

October Market Update - Vilas Point Real Estate

When it comes to understanding the real estate market, there are several key metrics that buyers and sellers should pay attention to. These metrics provide valuable insights into the current state of the market and can help inform decisions about buying or selling a property. Let's take a closer look at the correlation between these metrics and what they mean for buyers and sellers.
First, let's consider the "Months Supply of Inventory." This metric indicates how many months it would take to sell all the current inventory of homes on the market if no new listings were added. In this case, the months supply of inventory is 2.03. This means that at the current pace of sales, it would take a little over two months to sell all the homes currently listed for sale.
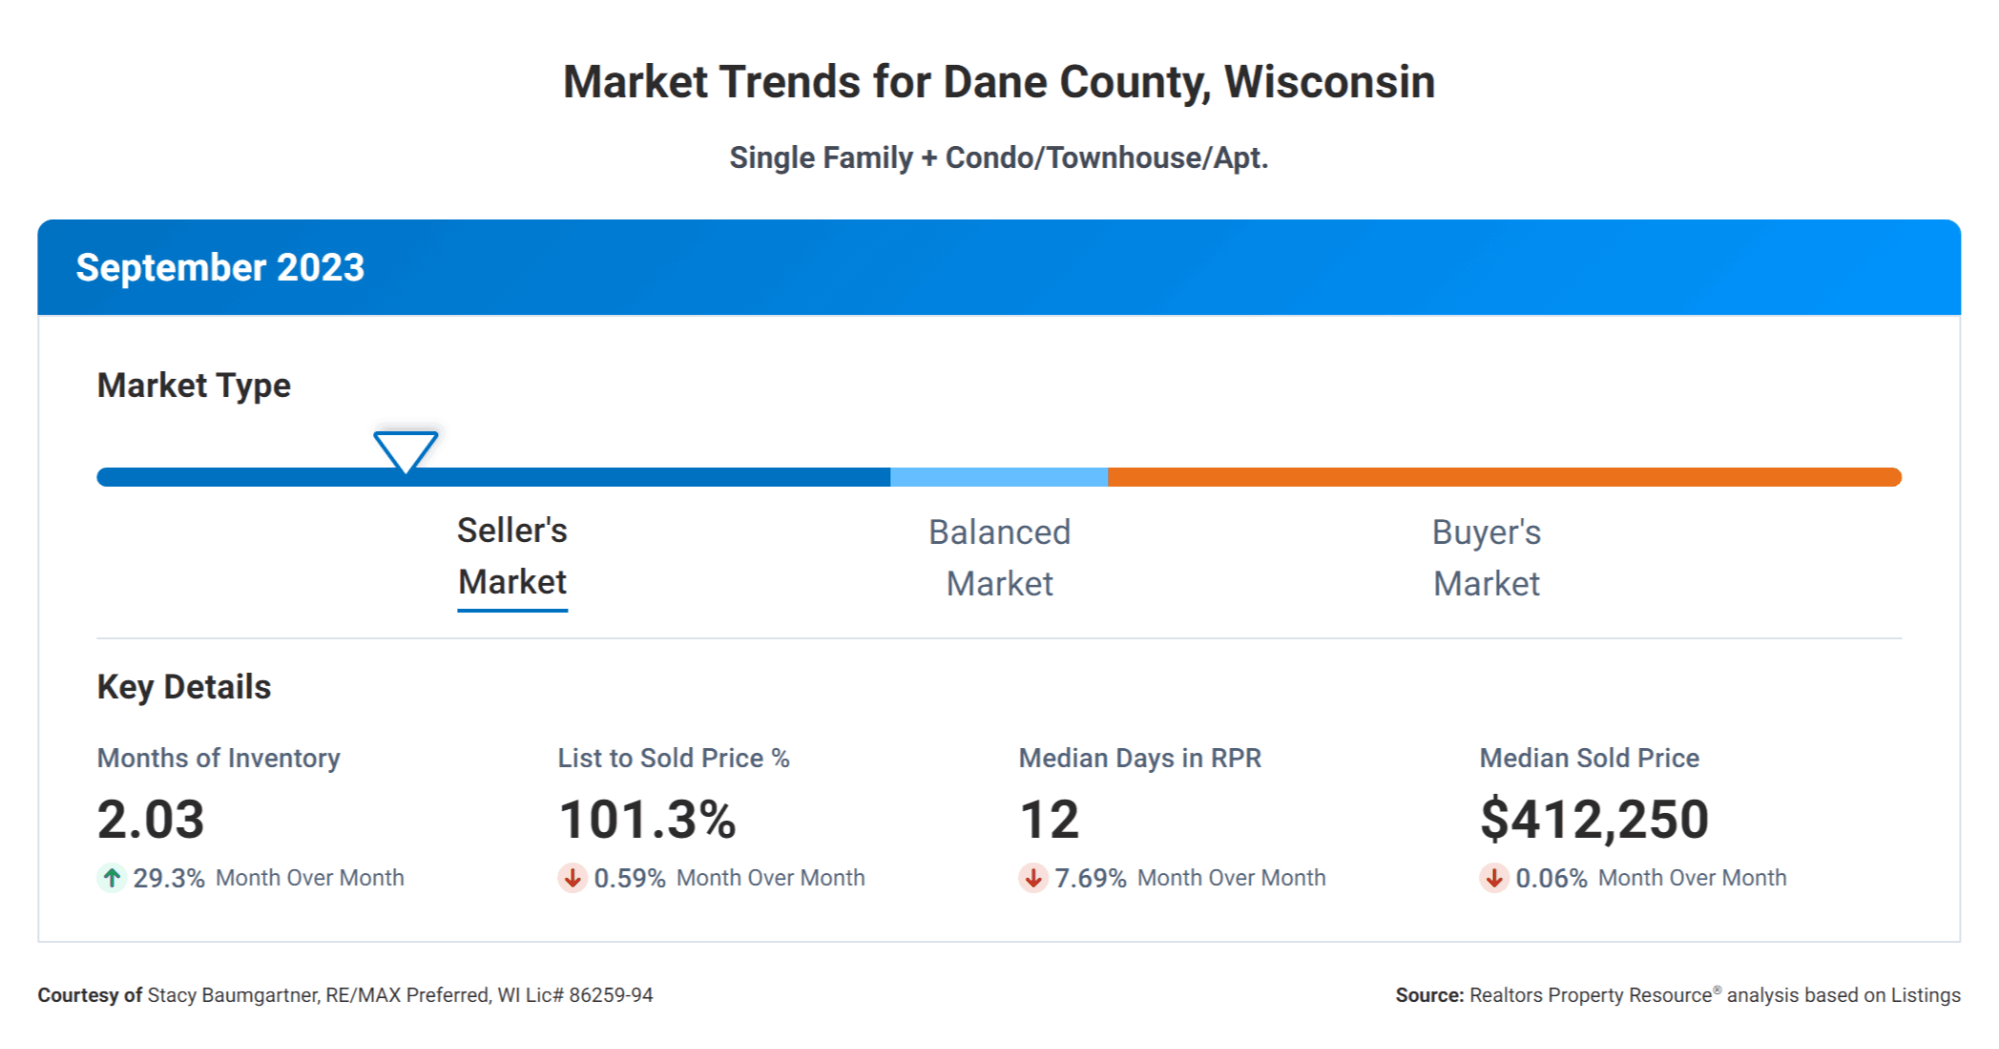
The next metric to consider is the "12-Month Change in Months of Inventory," which is reported as a +45%. This suggests that there has been a significant increase in the number of months it would take to sell all the current inventory compared to the previous year. This could indicate a shift towards a buyer's market, as there are more homes available for sale and it may take longer to sell them.
Moving on to the "Median Days Homes are On the Market," this metric tells us how long, on average, homes are staying on the market before being sold. In this case, the median days homes are on the market is 12. This is a relatively short period, indicating a fast-paced market where properties are being sold quickly. For sellers, this means that their homes have a good chance of selling within a short period of time.
The "List to Sold Price Percentage" is another important metric to consider. It represents the percentage of the original listing price that homes are actually selling for. In this case, the list to sold price percentage is 101.3%. This suggests that, on average, homes are selling for slightly more than their original listing price. For sellers, this is a positive sign as it indicates that there may be room for negotiation and potentially higher profits.
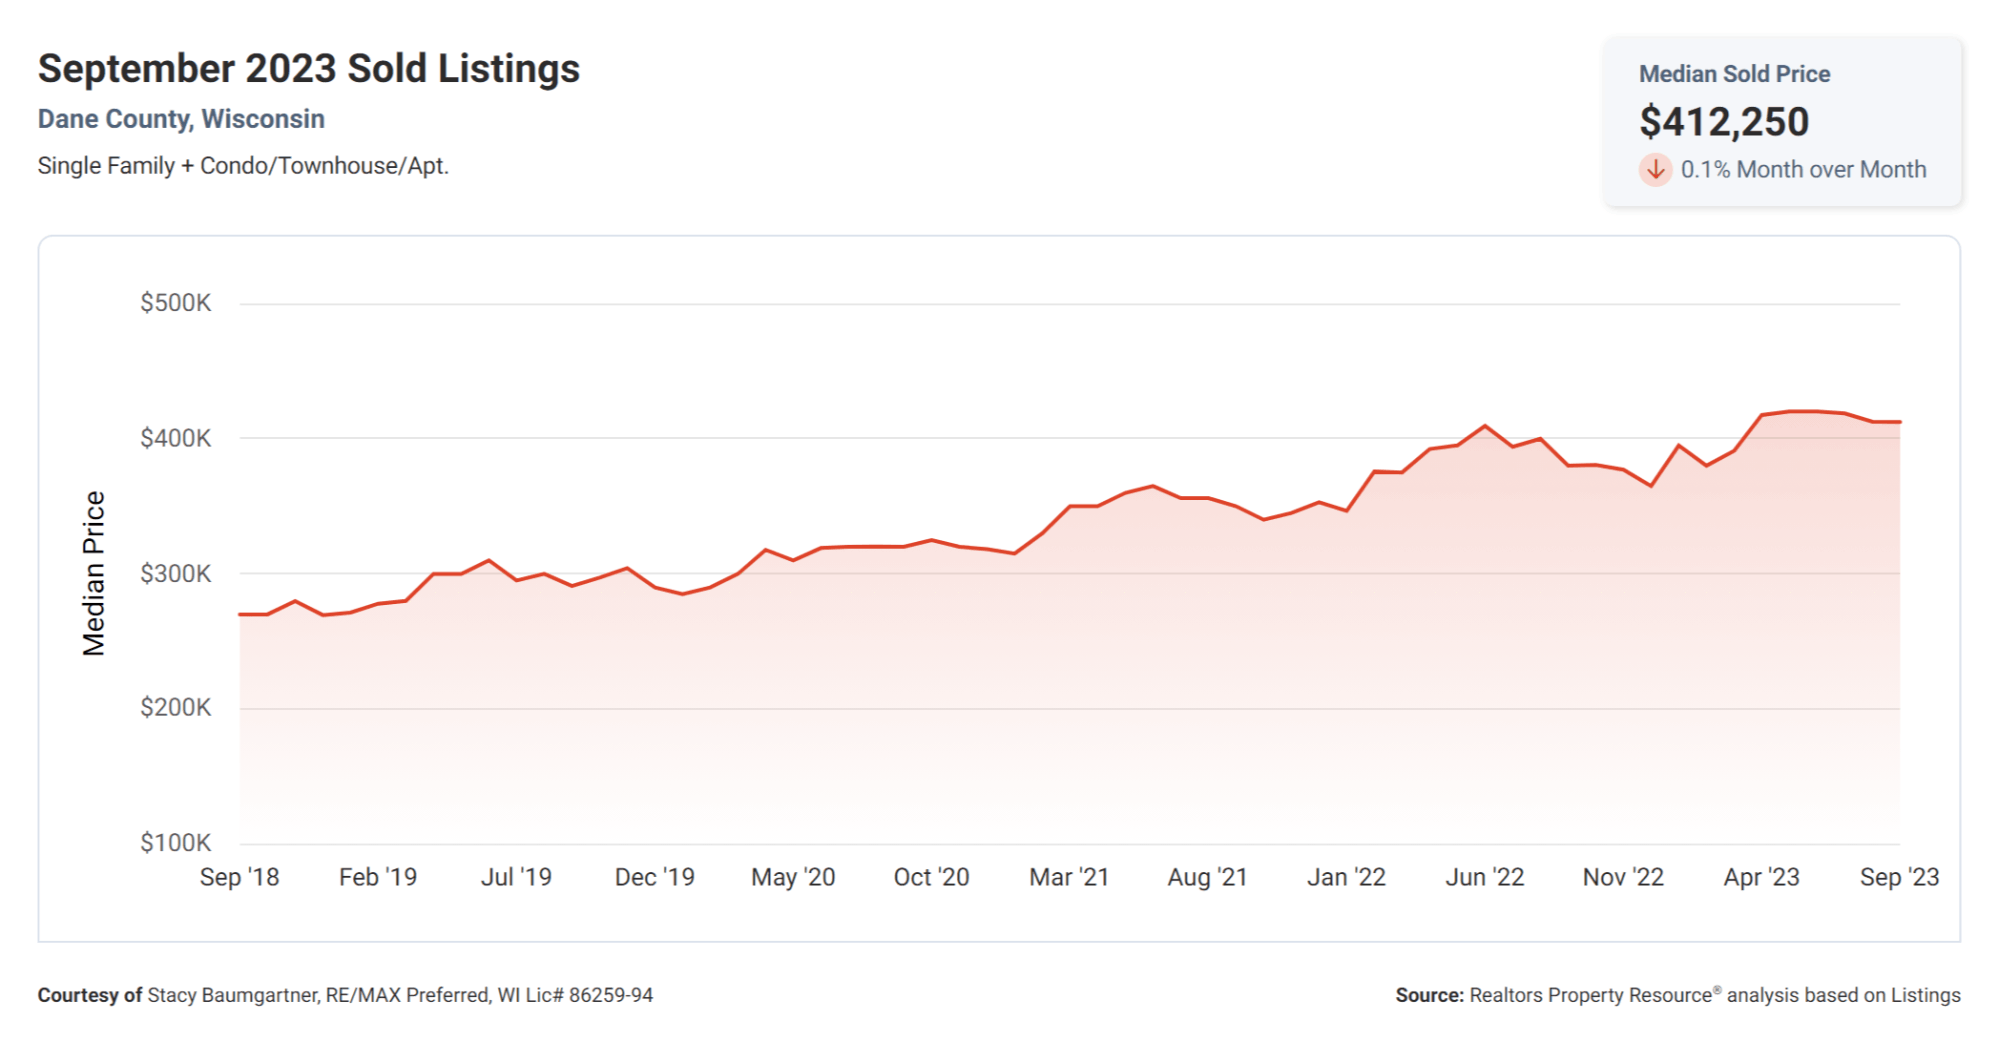
Lastly, let's look at the "Median Sold Price," which is reported as $412,250. This metric represents the midpoint of all the home prices sold in the market. It provides an insight into the overall price range and can help both buyers and sellers gauge the value of a property. For sellers, a higher median sold price indicates a potentially more lucrative market, while buyers may need to adjust their expectations based on this figure.
In summary, these real estate metrics provide a snapshot of the current market conditions and can help both buyers and sellers make informed decisions. While the months supply of inventory and the change in months of inventory point towards a potentially shifting market, the median days homes are on the market and the list to sold price percentage suggest a fast-paced and potentially profitable environment for sellers. The median sold price gives buyers and sellers an idea of the overall price range in the market. Ultimately, staying informed about these metrics can help buyers and sellers navigate the real estate market with confidence.
Categories
Recent Posts